
Assay Readiness / Zprime
Zprime Formula
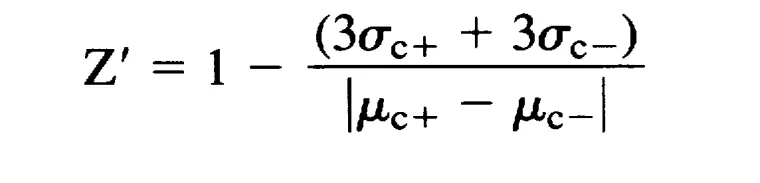
Basically Z’ is a quantification of the separation band quality. As you can see in the table, an ideal assay is close to 1. Note, it is normally impossible to obtain an assay of exactly 1.0. Biochemical assays are regularly 0.8 to above 0.9. While in biochemical assays the cutoff is usually 0.5; a slightly lower cutoff of 0.4 is acceptable in cellular assays. Under 0.4/0.5 is a poor assay and gets closer and closer to a binary yes/no assay. Under 0 there is no assay and screening should not be attempted.
Zprime Good vs. Bad Example
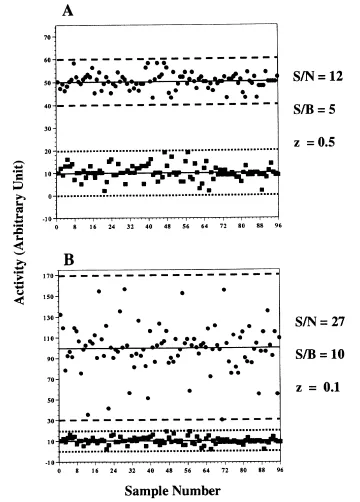
Here are two examples of data from an assay from a Z’ of 0.5 and Z’ of 0.1. With 0.5 there is a healthy separation between the positive and negative controls when taking the noise standard deviation of samples into account. When quality drops to 0.1, the separation band drops and it becomes increasingly likely that controls have potential to overlap and hit confidence will decline.
Separation Band
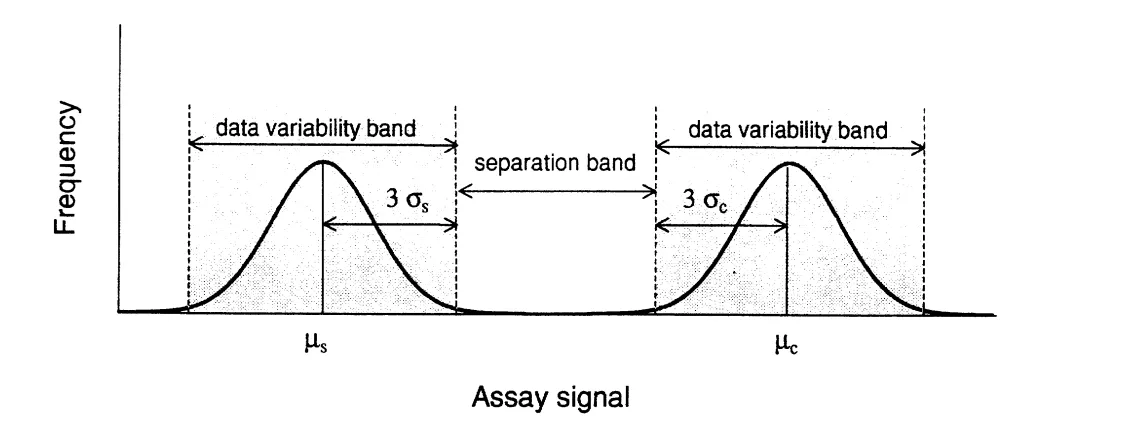
In order to have a successful screen we should have a robust separation band. The separation band considers both the distance between (separation) of the positive and negative controls and the combined standard deviation of those controls. A good assay has good separation between both positive and negative controls even when considering 3 times the standard deviation of the controls. In other words when considering the combined standard deviations of the assay, is there still a good separation in the assay or is there overlap? If there is overlap, there is a higher chance of false positive/false negative hit identification and suboptimal results.